
Fall Project 1: Das Lab
Previously, it has been demonstrated that probing RNA with chemical modification reagents, also known as chemical mapping or chemical footprinting, can be used to identify ligand-binding regions on RNAs comparing site-specific reactivity changes of nucleotides incubated with small molecules. [1,2] My plan was to apply this proof-of-concept result with the Das Lab’s high-throughput chemical mapping protocol to generate a dataset of millions to billions of RNA-ligand interactions to develop a deep learning model that predicts sequence-specific binding of small molecules.
After demonstrating that the trained model could accurately predict both binding affinity and binding location using RNA and small molecule features, my initial goal was to fine-tune it to identify small molecule binders for pathogenic RNA targets—aiming to disrupt their structure and, consequently, their function. However, my interest gradually shifted toward designing RNA aptamers for diagnostic applications or for complex biological computation. My plan was then to expand the model by incorporating a reinforcement learning framework to generate designs for high-affinity aptamers for any given small molecule input.
While I unfortunately had to forfeit this project, I did receive some preliminary results that showed that an RNA foundation model can be fine-tuned to predict small molecule binding events.
A pilot experiment was performed July 2024 performing the SHAPE chemical mapping protocol on a library of 3000 RNAs designed to have pseudoknot motifs incubated with small molecules known to bind RNA - Argininamide, Erythromycin, Kanamycin, Mitoxantrone, Paromomycin, Spectinomycin, and Tetracycline.
I fine-tuned multiple models of RibonanzaNet, adjusting hyperparameters and model architecture. At first, I tried to fine-tune RibonanzaNet alongside an embedding generator block so that the model could generalize beyond the initial 7 small molecules in the training data. But, the training time was taking too long (around 2 hours/epoch) for a pilot experiment with the primary goal being to test whether RibonanzaNet already contains the information necessary within RNA sequence and/or pairwise embeddings to predict interactions with small molecules (given just a small initial amount of data for training).
The base RibonanzaNet model was trained on data from two sepearate chemical probing techniques: SHAPE (Selective Acylation of the 2’ Hydroxyl as Analyzed by Primer Extension) probing with the electrophilic reagent 2-aminopyridine-3-carboxylic acid imidazolide (2A3) [3] as well as DMS chemical footprinting [4]. My initial experiment was simple: adjust the final decoder layer of RibonanzaNet to instead predict 2-8 reactivity profiles, with each reactivity profile being a new small molecule condition. I would first assess model performance through quick visual checks on heat maps of experimental and predicted reactivity profiles under each condition. If the predictions looked promising, I would then generate a more robust quantitative analysis to benchmark model predictions.
The Experiment
Experimental Null Hypothesis: RibonanzaNet cannot be fine-tuned on 1k new labeled examples of RNA/small-molecule chemical reactivity profiles to make accurate predictions on the test data.
Possible explanations of Null Hypothesis:
1) The experimental data itself is pure noise. There is no predictable pattern that even a million-parameter LLM can learn.
2) The model needs more diverse training data to learn.
3) The model needs more parameters or a more sophisticated architecture tailored to the new task in order to learn RNA-small molecule reactivity profiles .
Selected Results - Qualitative
The best results qualitatively from this pilot experiment came from RibonanzaNet-SM 005. This model was trained with a final decoder layer of 8 reactivity profiles, the first seven being reactivity differences between the small molecule condition and a no small molecule baseline (I called this baseline “NoDr” for “No Drug”, since all of these molecules are drugs). The last vector was the absolute reactivity profile without small molecule incubation. The idea is that since I used MSE or MCRSE as the loss function during training, adding in the absolute reactivity vector would normalize the gradient so that the model would not overfit to the data with the largest magnitude of reactivity differences. However, as you will see with my quantitative results, this still became a problem as there was a direct correlation in magnitude of reactivity differences with the PCC of predictions under each drug condition. But again, this was just a preliminary experiment to evaluate whether RibonanzaNet contained information necessary within the pretrained model to make predictions under new conditions. Ideally, since this model is relatively sparse and easy to train, it would be used my experimentalists with small datasets for fine-tuning to predict RNA behavior under other conditions. Alternatively, we would collect enough new RNA reactivity profiles with different small molecules so that, combined with an LLM that generates molecular embeddings and a new model architecture tailored to that task, we could retrain a model from scratch.
Here are some selected quantitative results , however, you can play around with generating heatmaps of all RNAs in the test dataset under each condition by copying this repository and running cells in this notebook
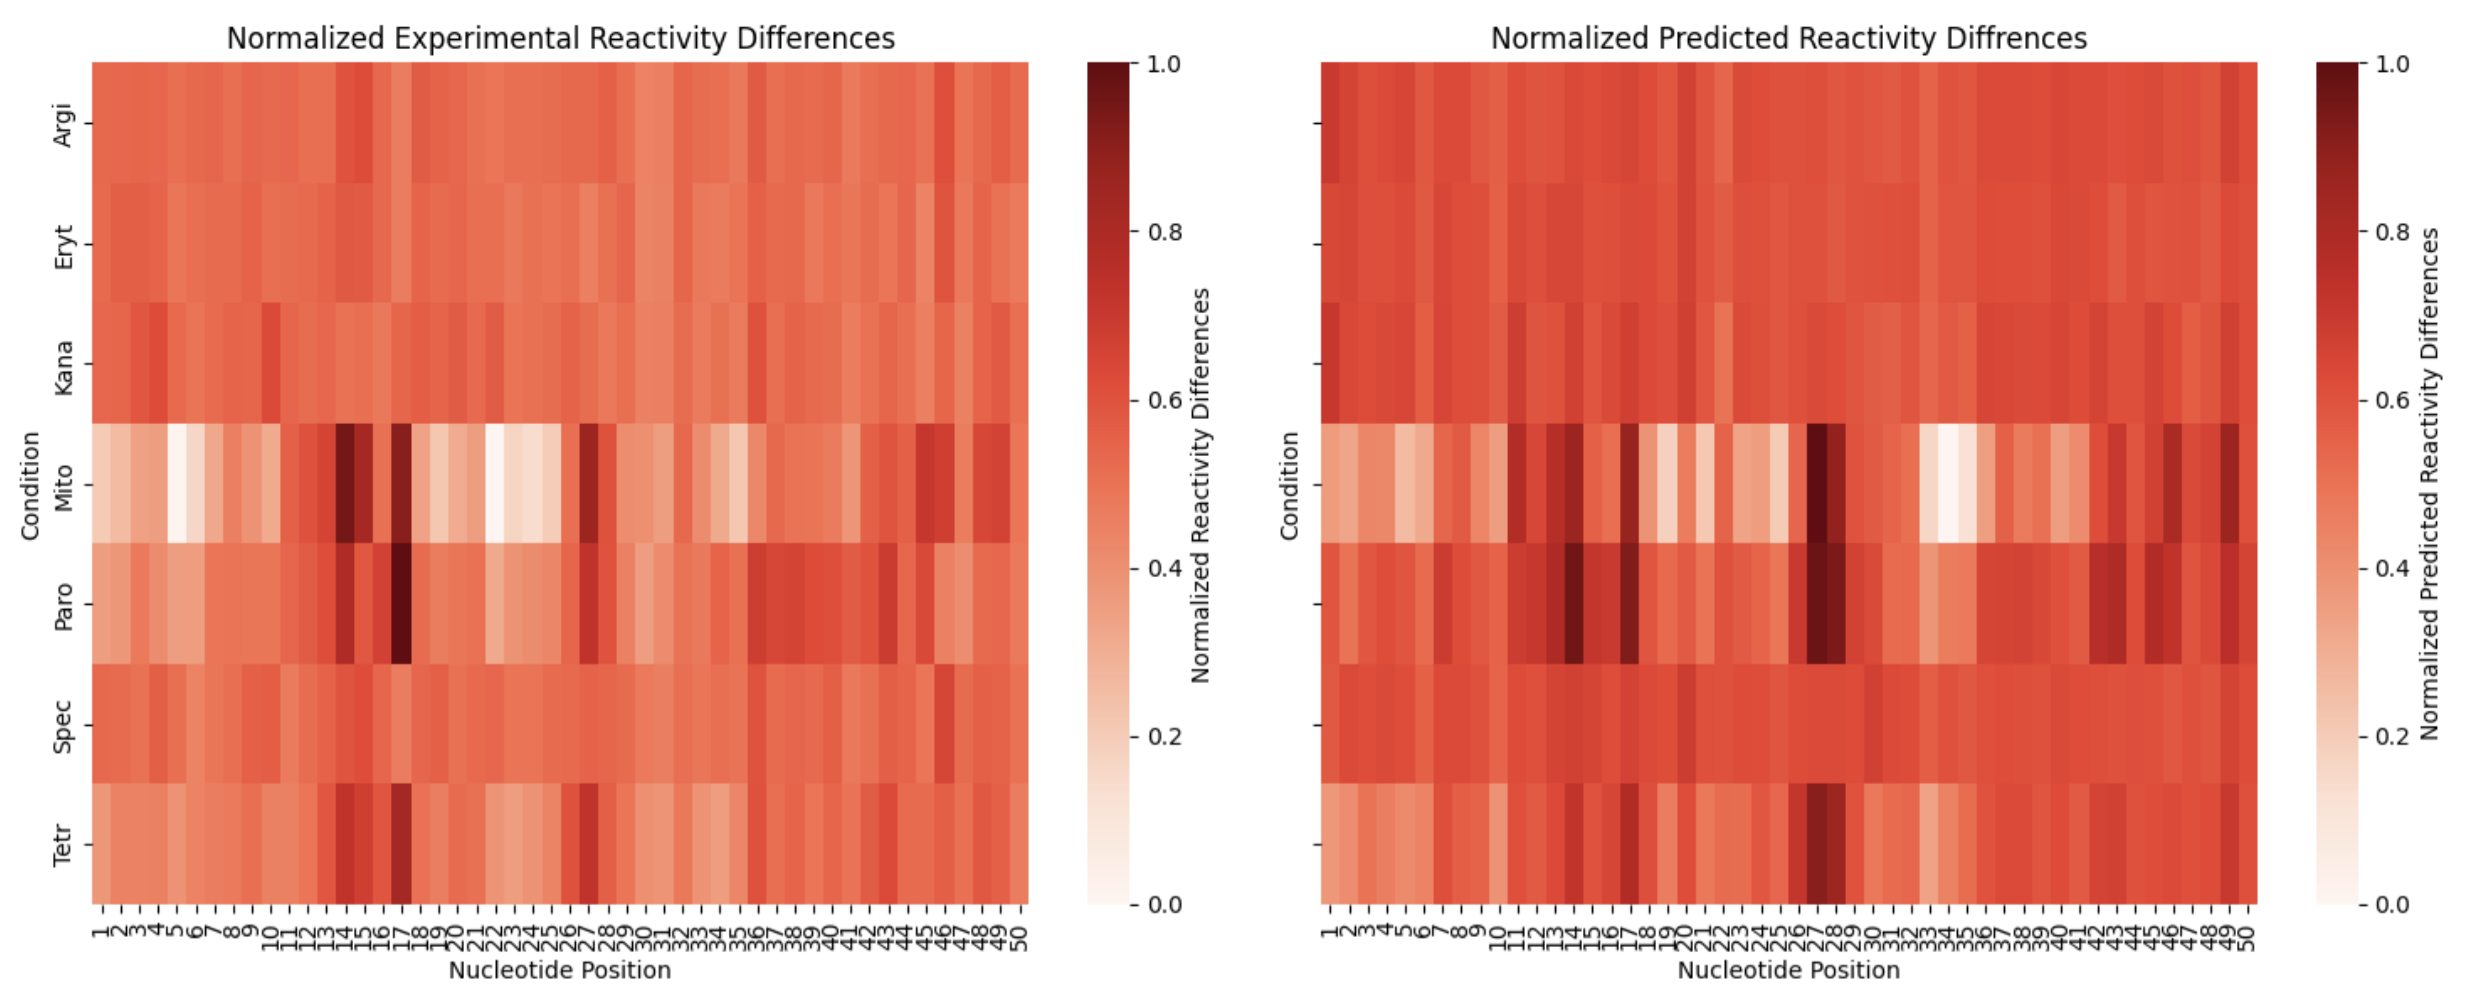
An example of different experimental and predicted reactivity differences on a sequence from the test set from RibonanzaNet 005 :
Sequence 13
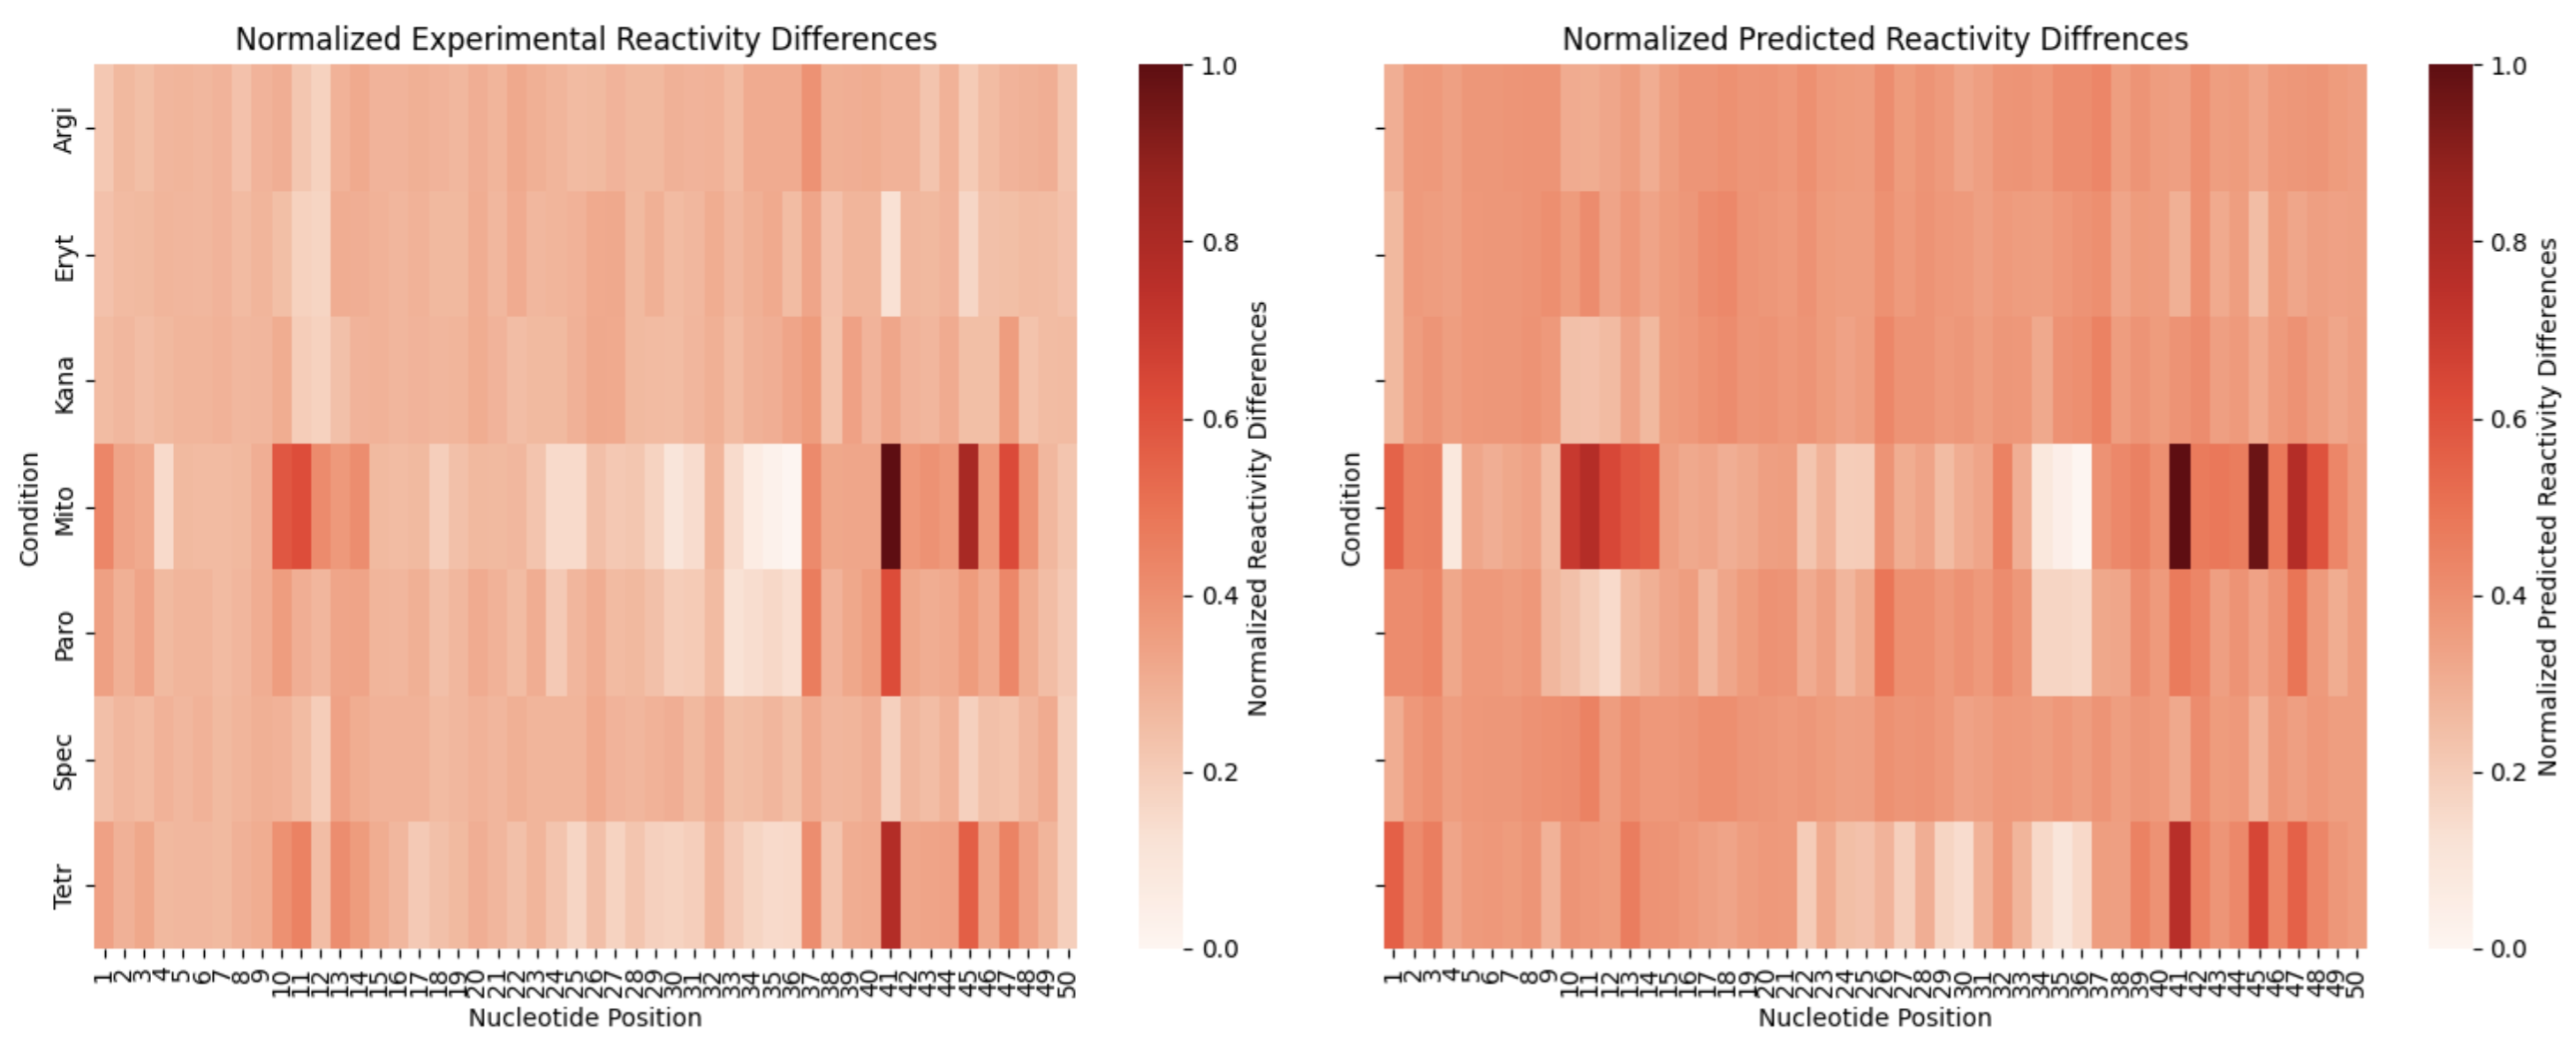
Sequence 2
A look at individual reactivity profiles (not normalized) for three conditions for sequence 2:
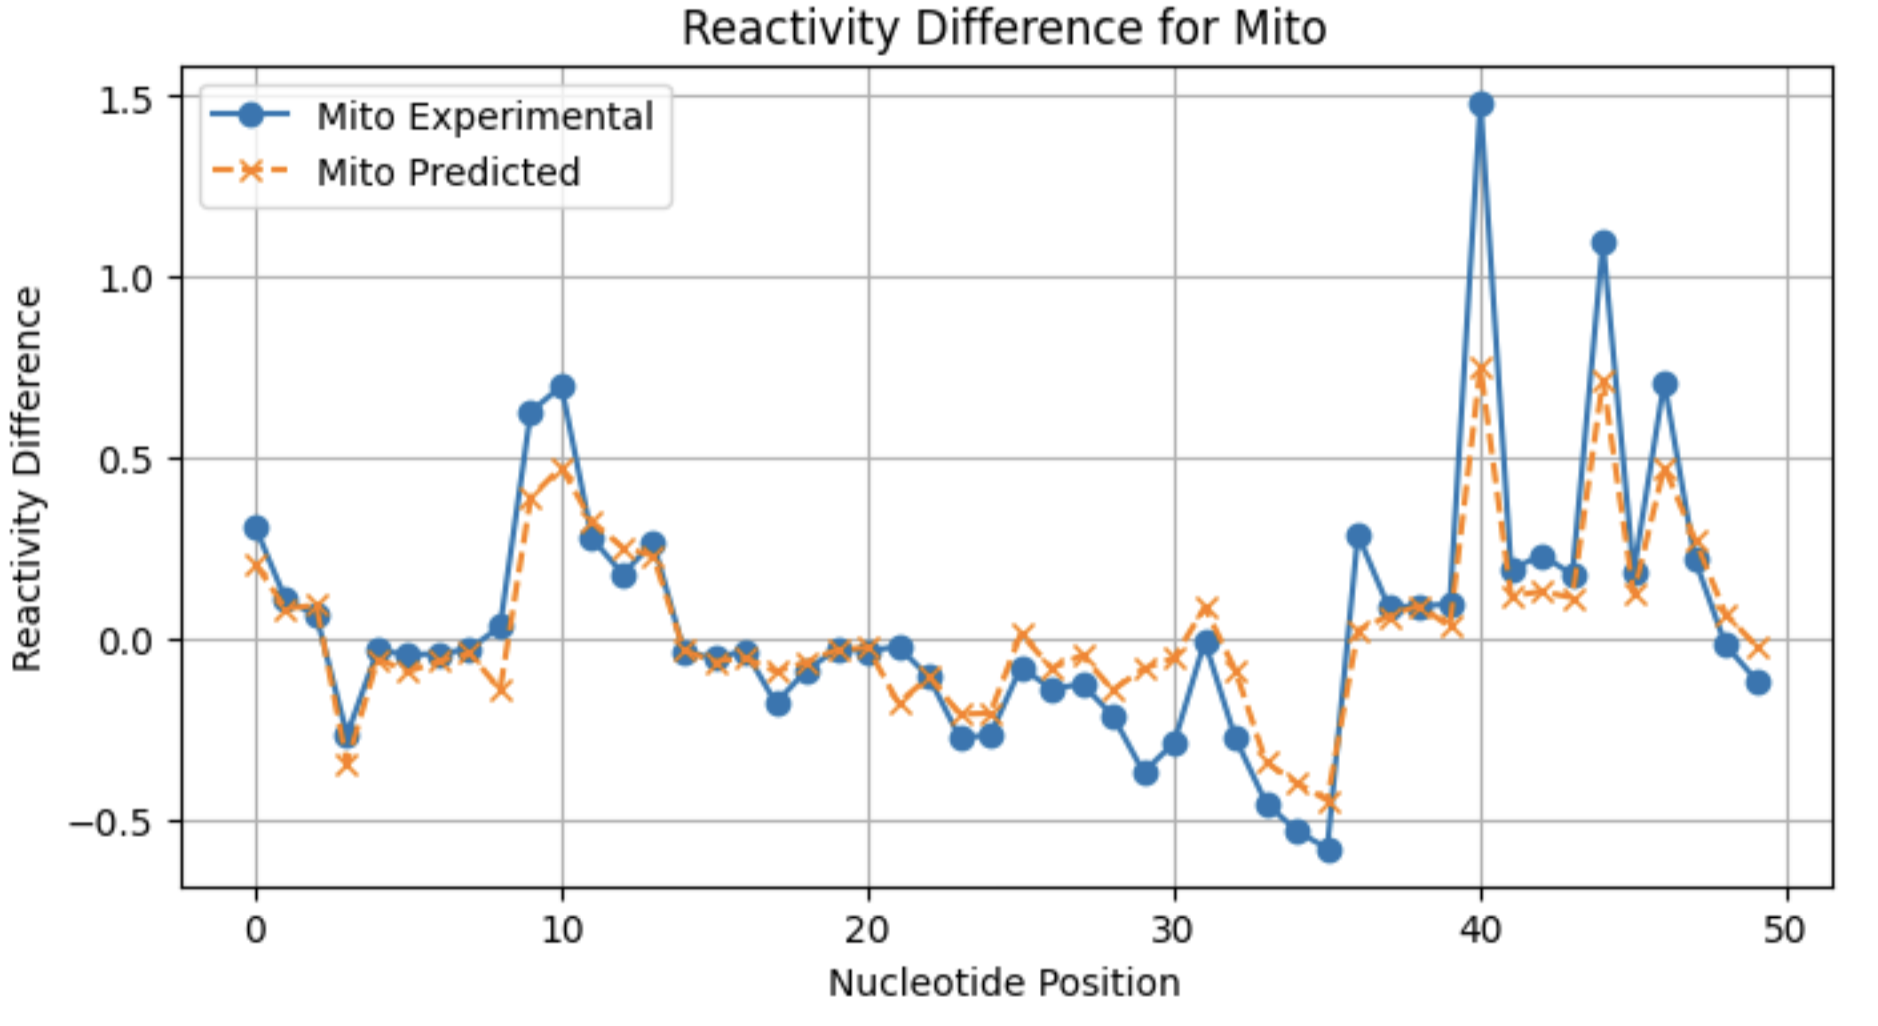
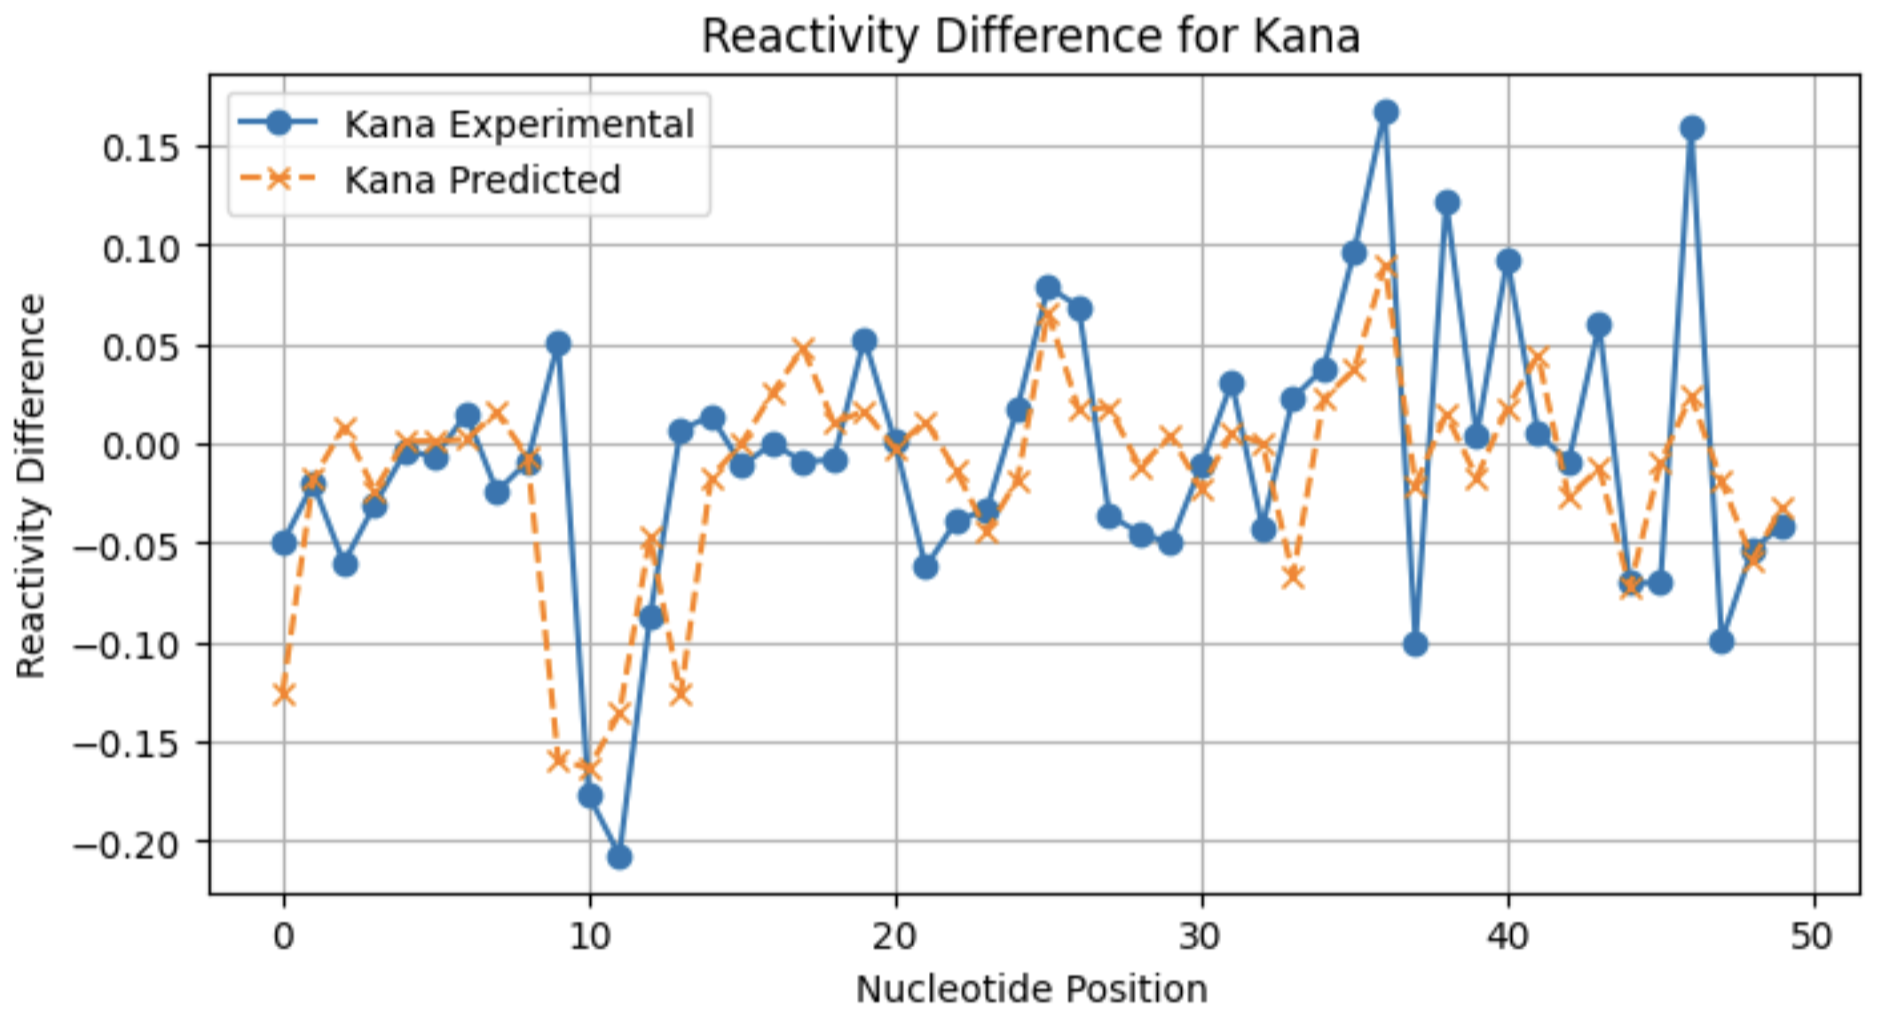
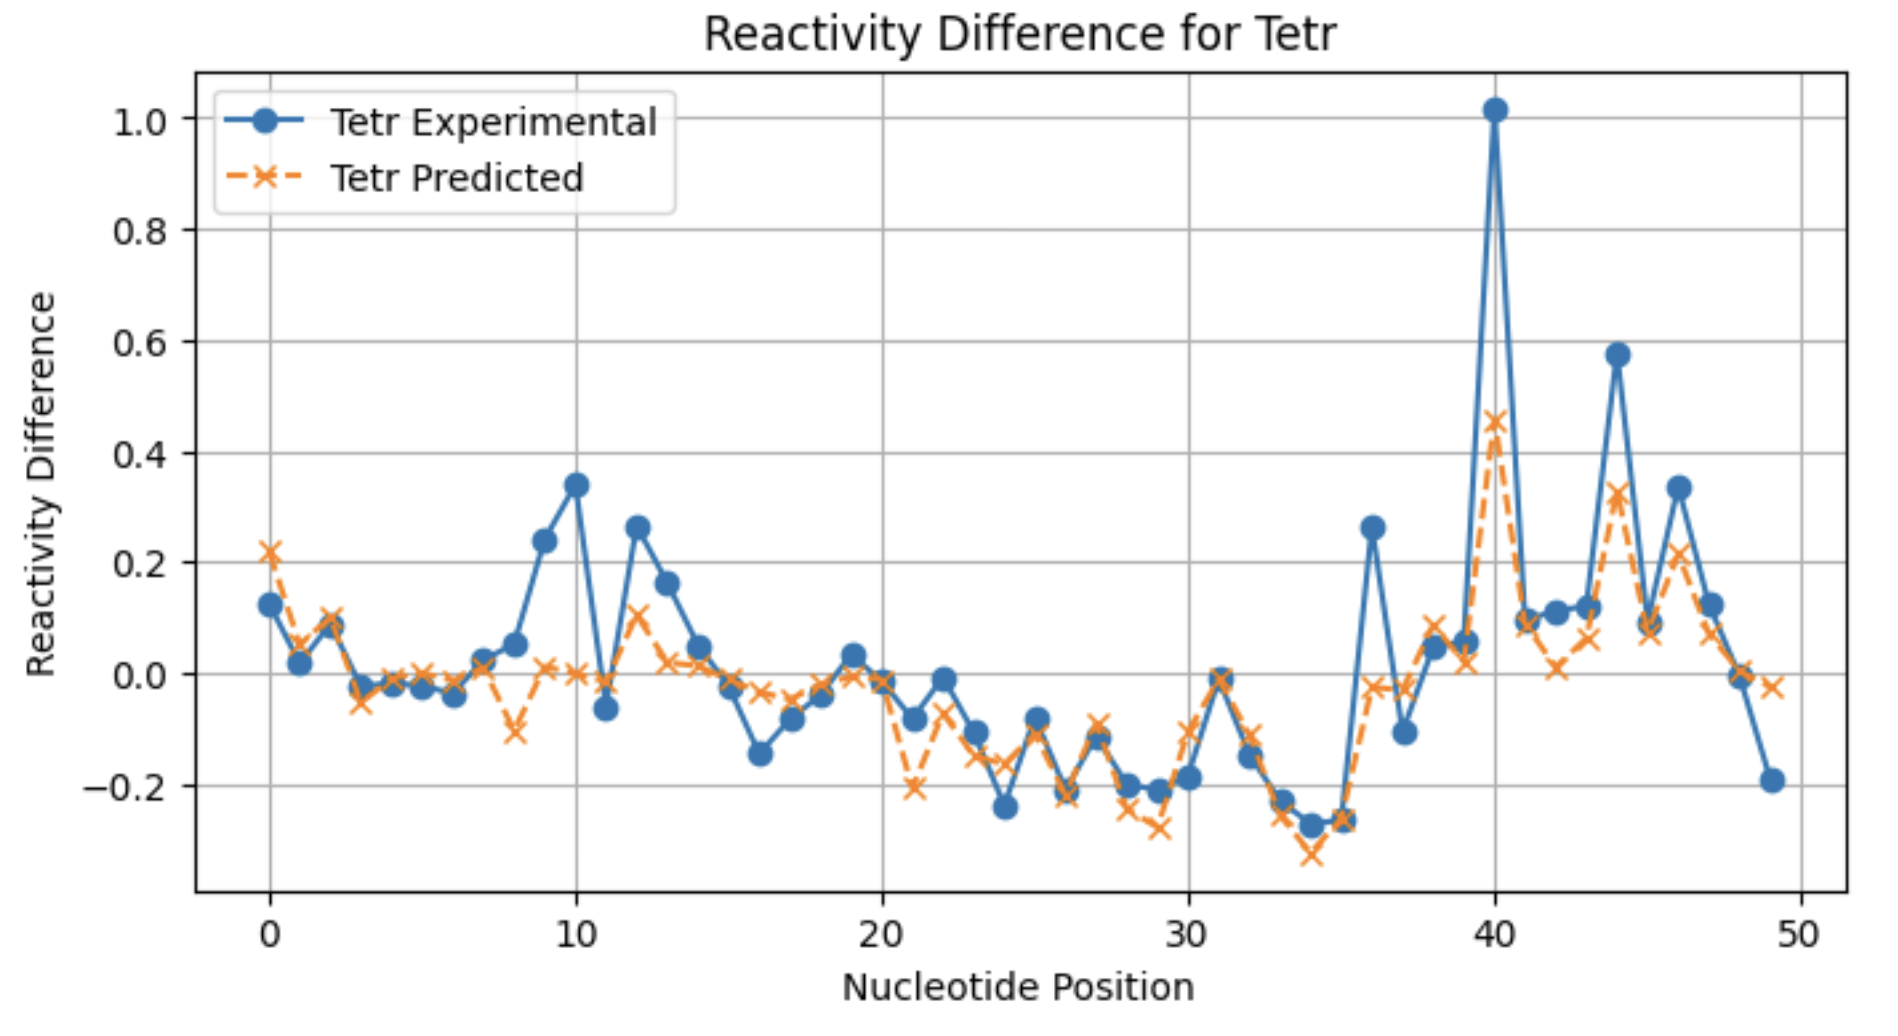
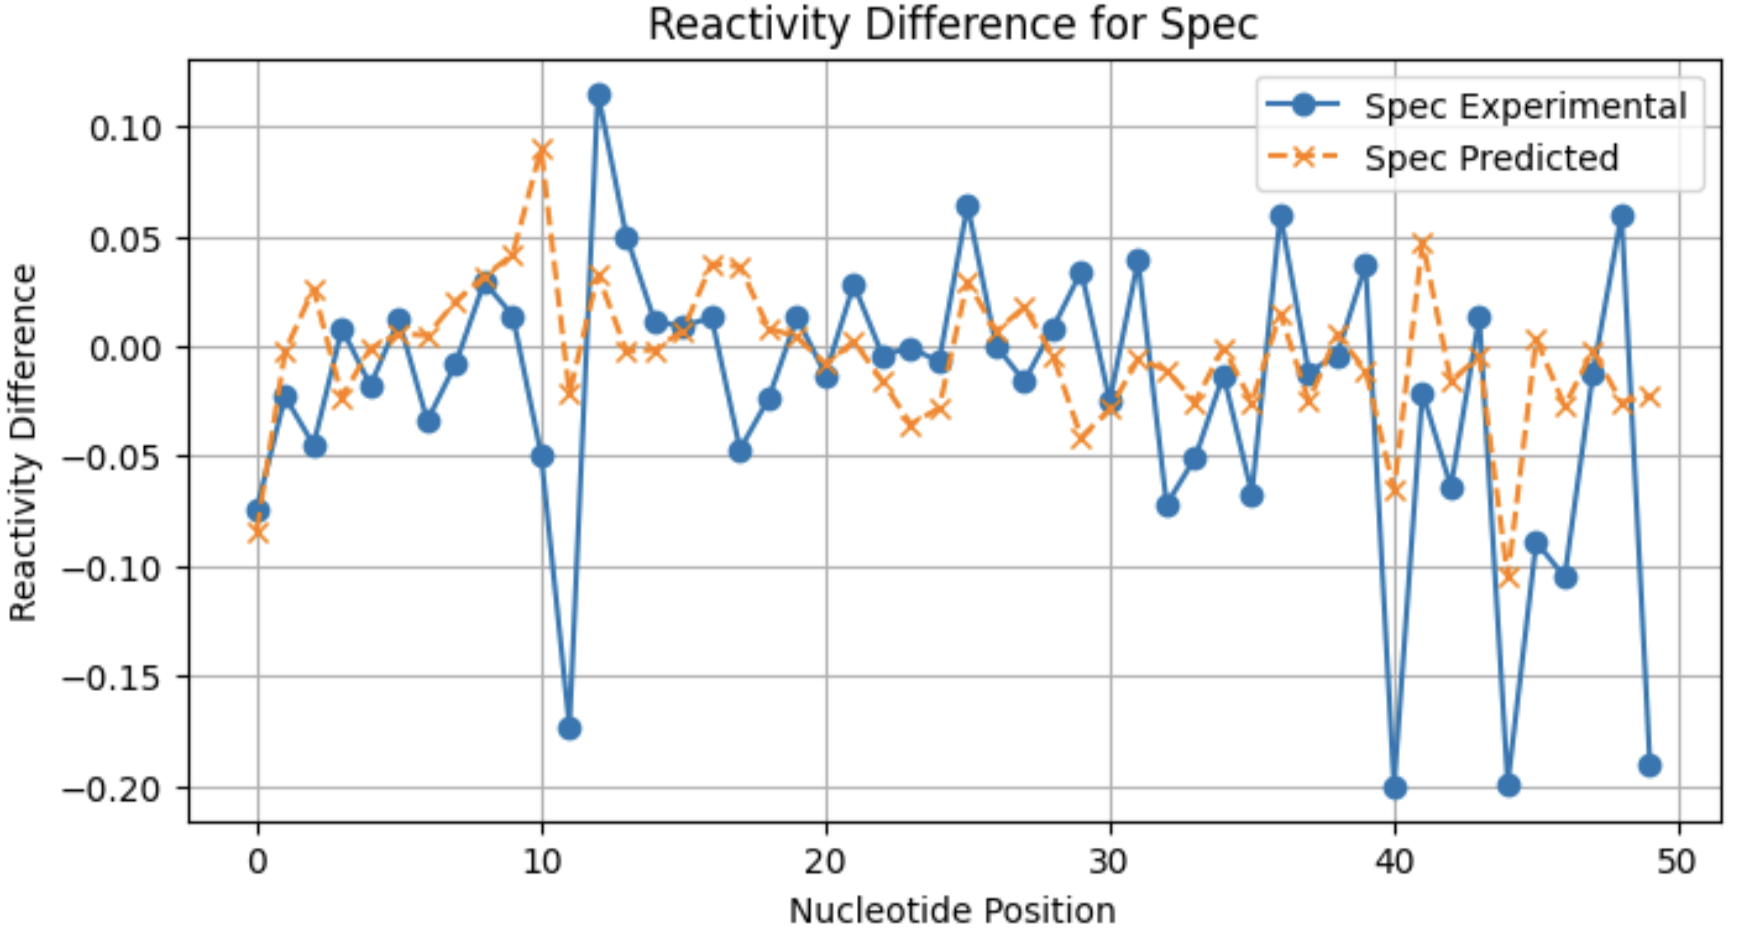
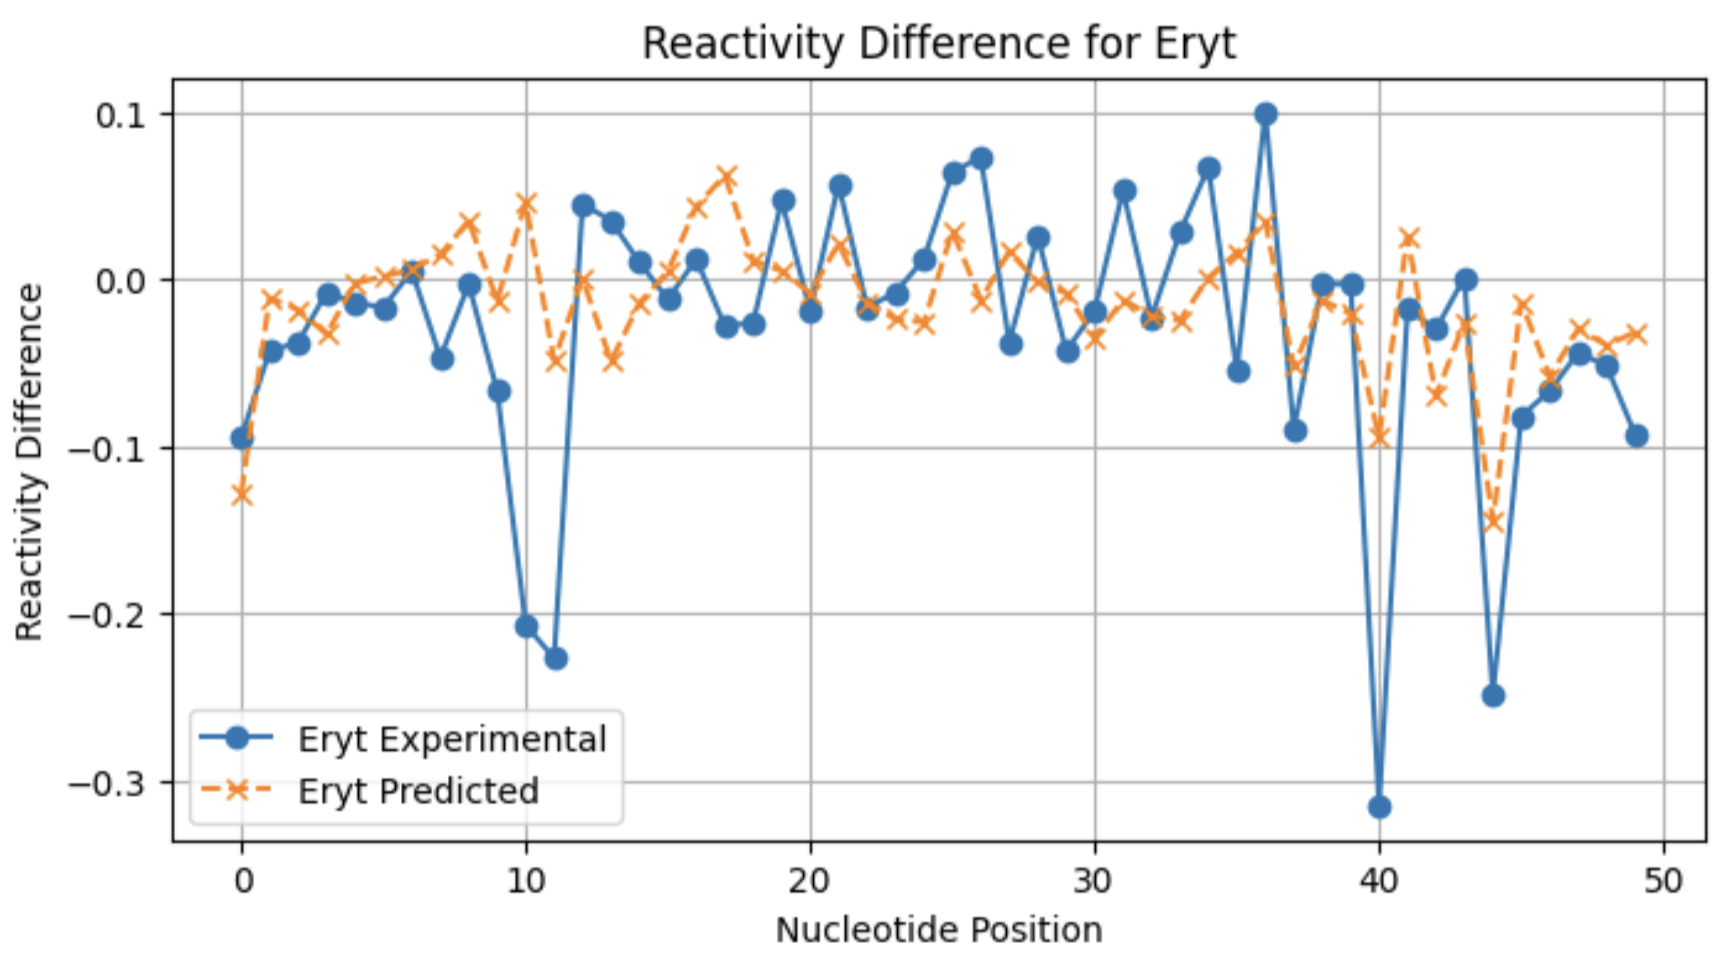
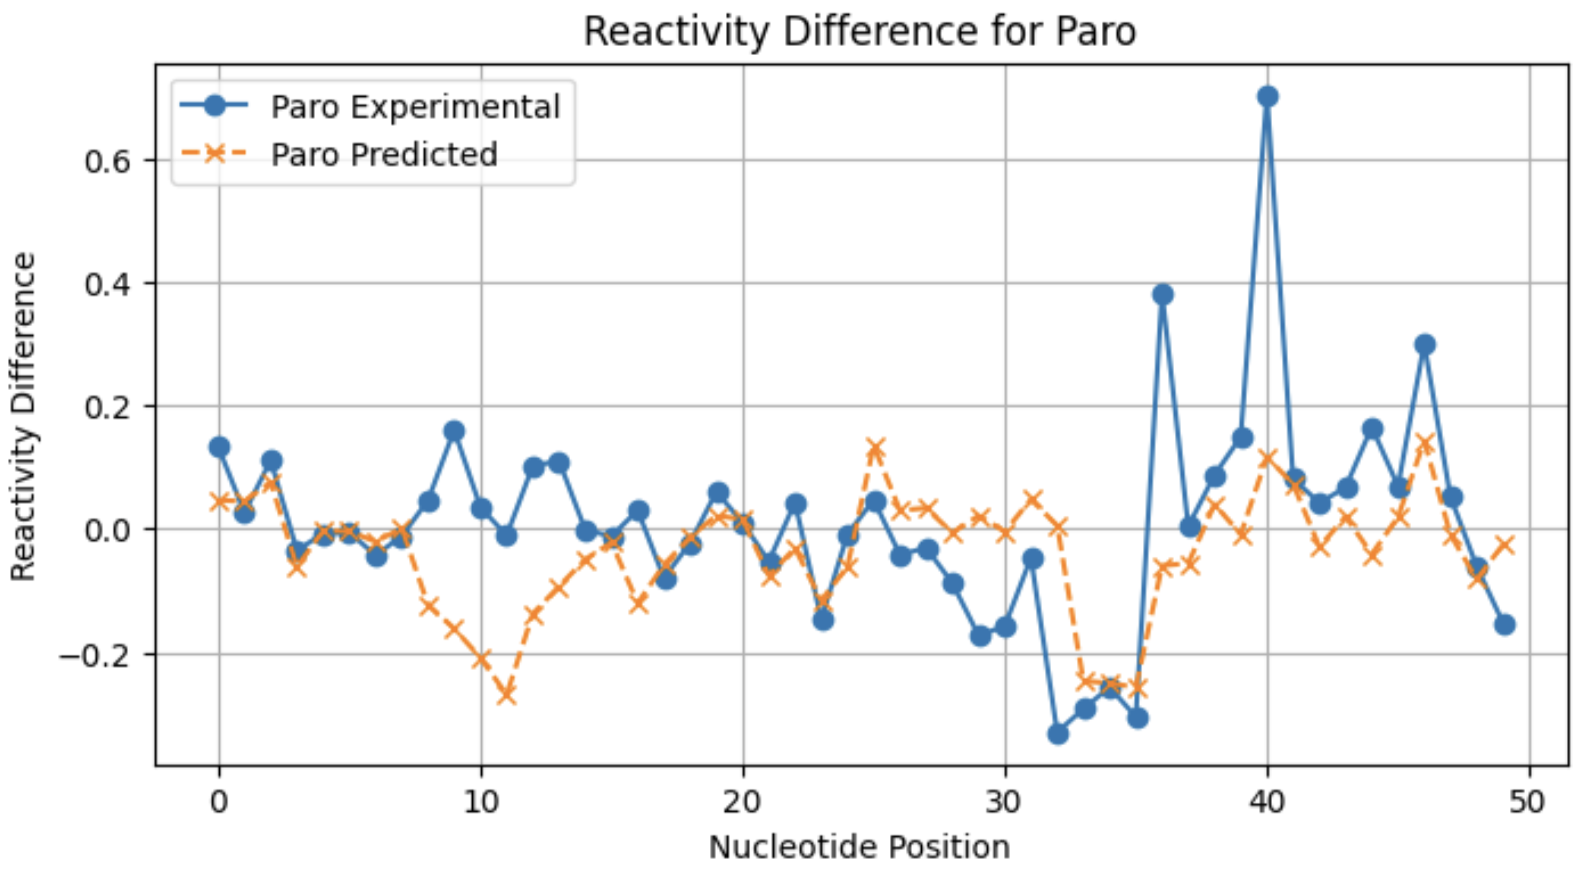

From these profiles, you can see that the model may not be as good at predicting large reactivity differences for conditions with a lower frequency of significant reactivity differences.
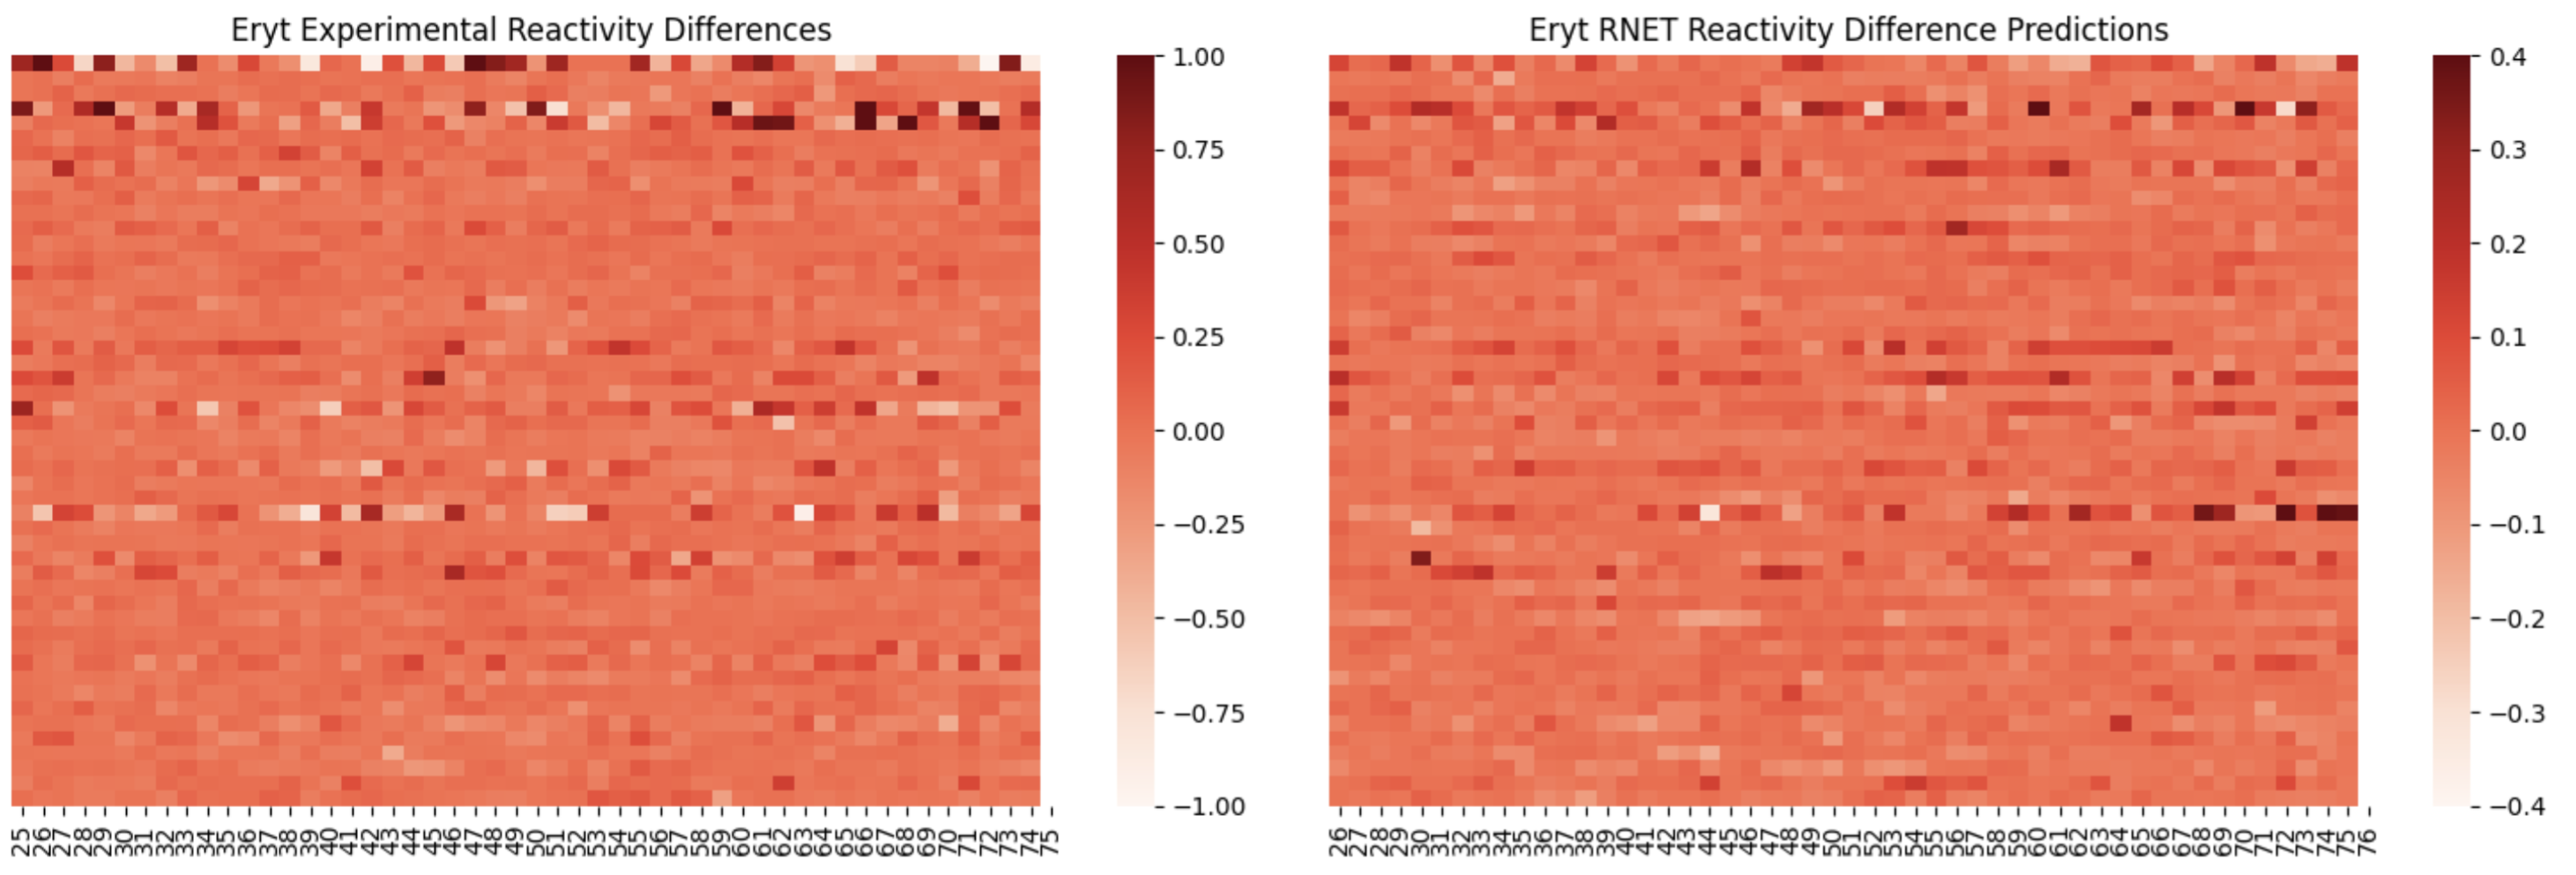
Here, I am showing how adding in the raw reactivity vector during training helps the model pick up on differences between conditions with less binding events (such as Erythromycin ):
On the left, is reactivity difference heatmap for sequences 50-100 without the raw reactivity vector during training, and on the right is with the raw reactivity vector included. You can see that there are a few sequences with what appears to be significant reactivity differences learned by the right model.
RibonanzaNet-004 No absolute reactivity vector included during training
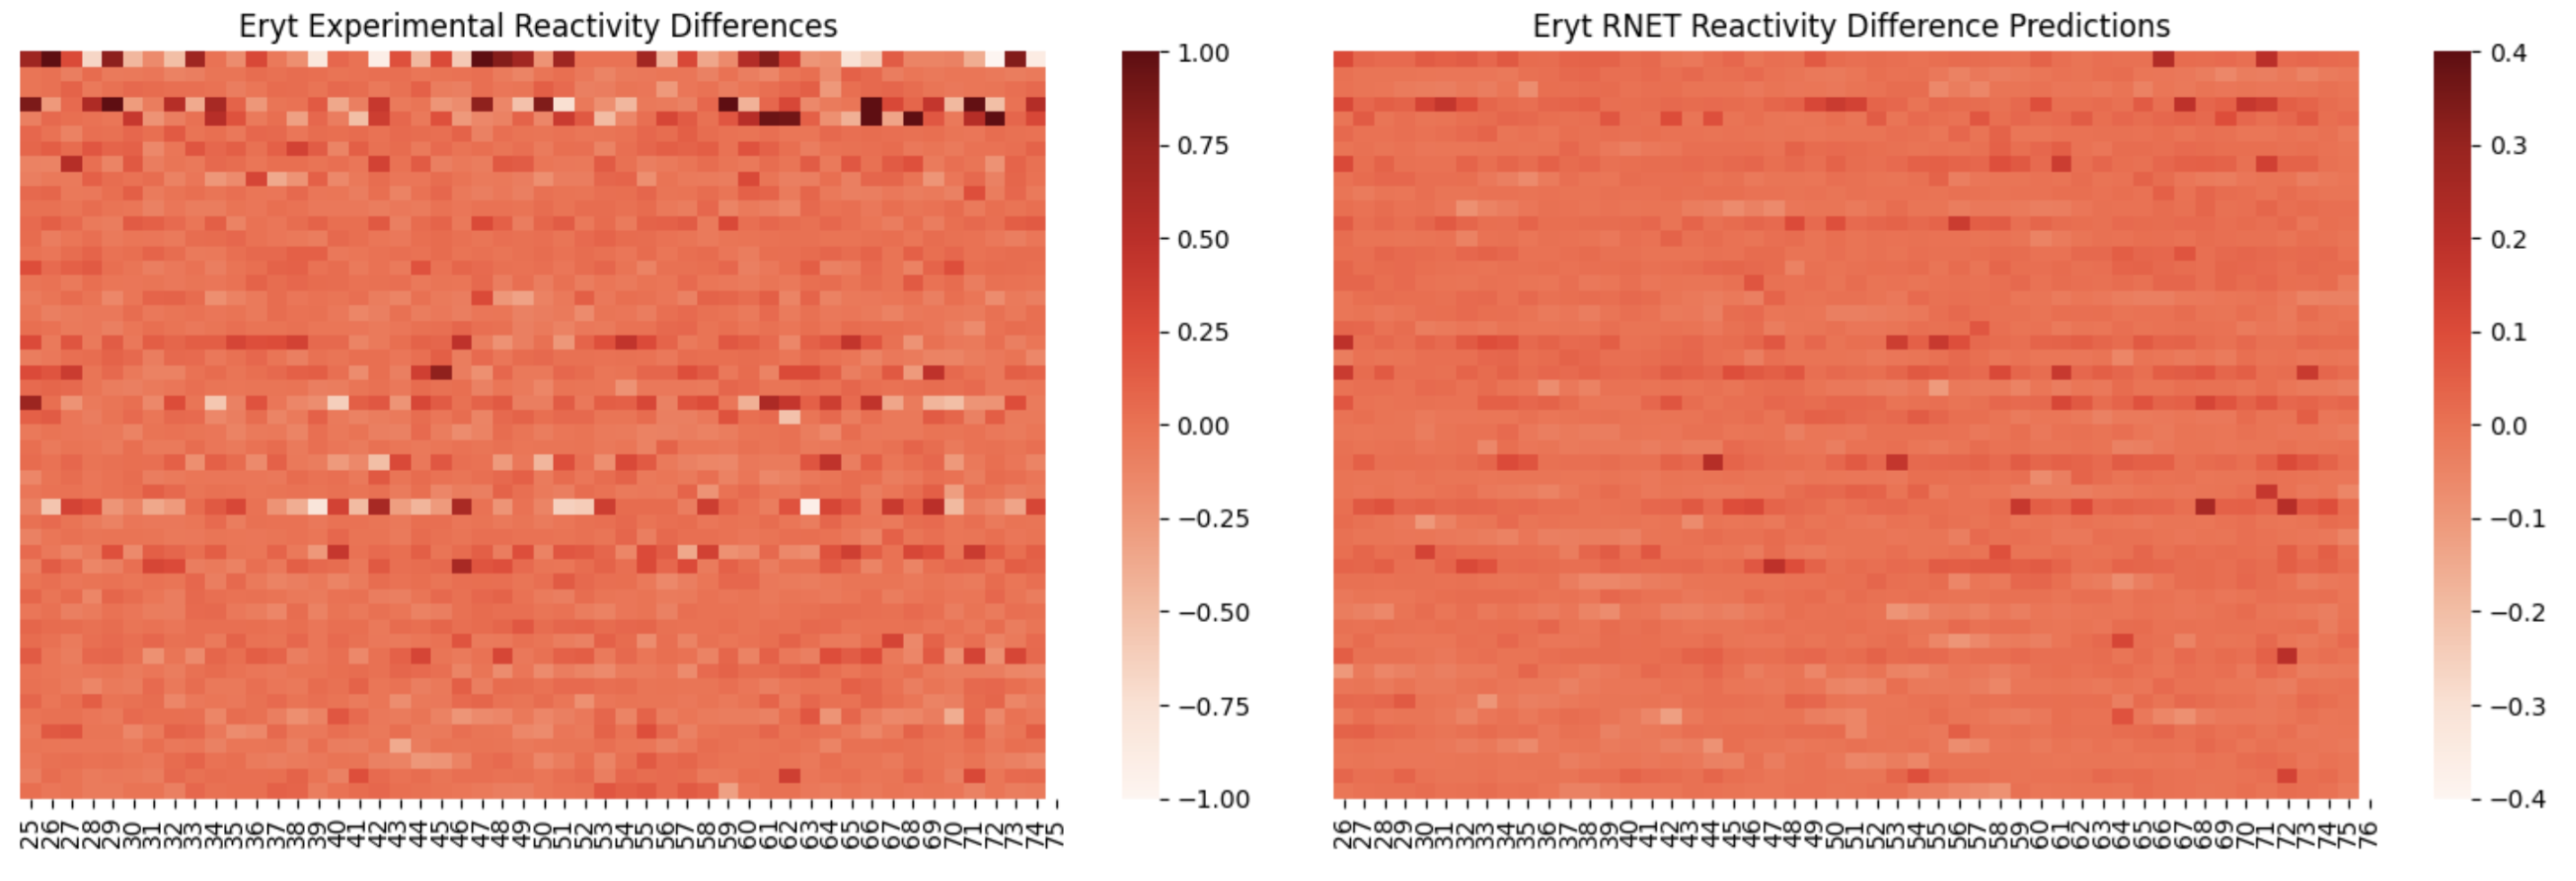
RibonanzaNet-005 Includes all reactivity differences, and the absolute reactivity vector
There is still much need for improvment in terms of accuracy, however this is a good start for guiding future fine-tuning projects.
Selected Results - Quantitative
The first quantitative metric that was also used to evaluate improvement during training is computing a pearson correlation coefficient between the experimental reactivity vectors and predictions. For RibonanzaNet-SM 005, here are the computed PCCs per each condition:
Average PCC per condition:
Argi 0.151971
Eryt 0.200652
Kana 0.278094
Mito 0.746358
Paro 0.555189
Spec 0.127898
Tetr 0.611173
Another quantitative metric I used was to flag nucleotides that are in top 80% of reactivity difference, compute a sliding window sum of flagged nucleotides, and then compute a PCC of predictions with experimental flagged nucleotides.
Average PCC per condition:
Argi 0.164781
Eryt 0.197671
Kana 0.221571
Mito 0.651125
Paro 0.436432
Spec 0.170088
Tetr 0.552999
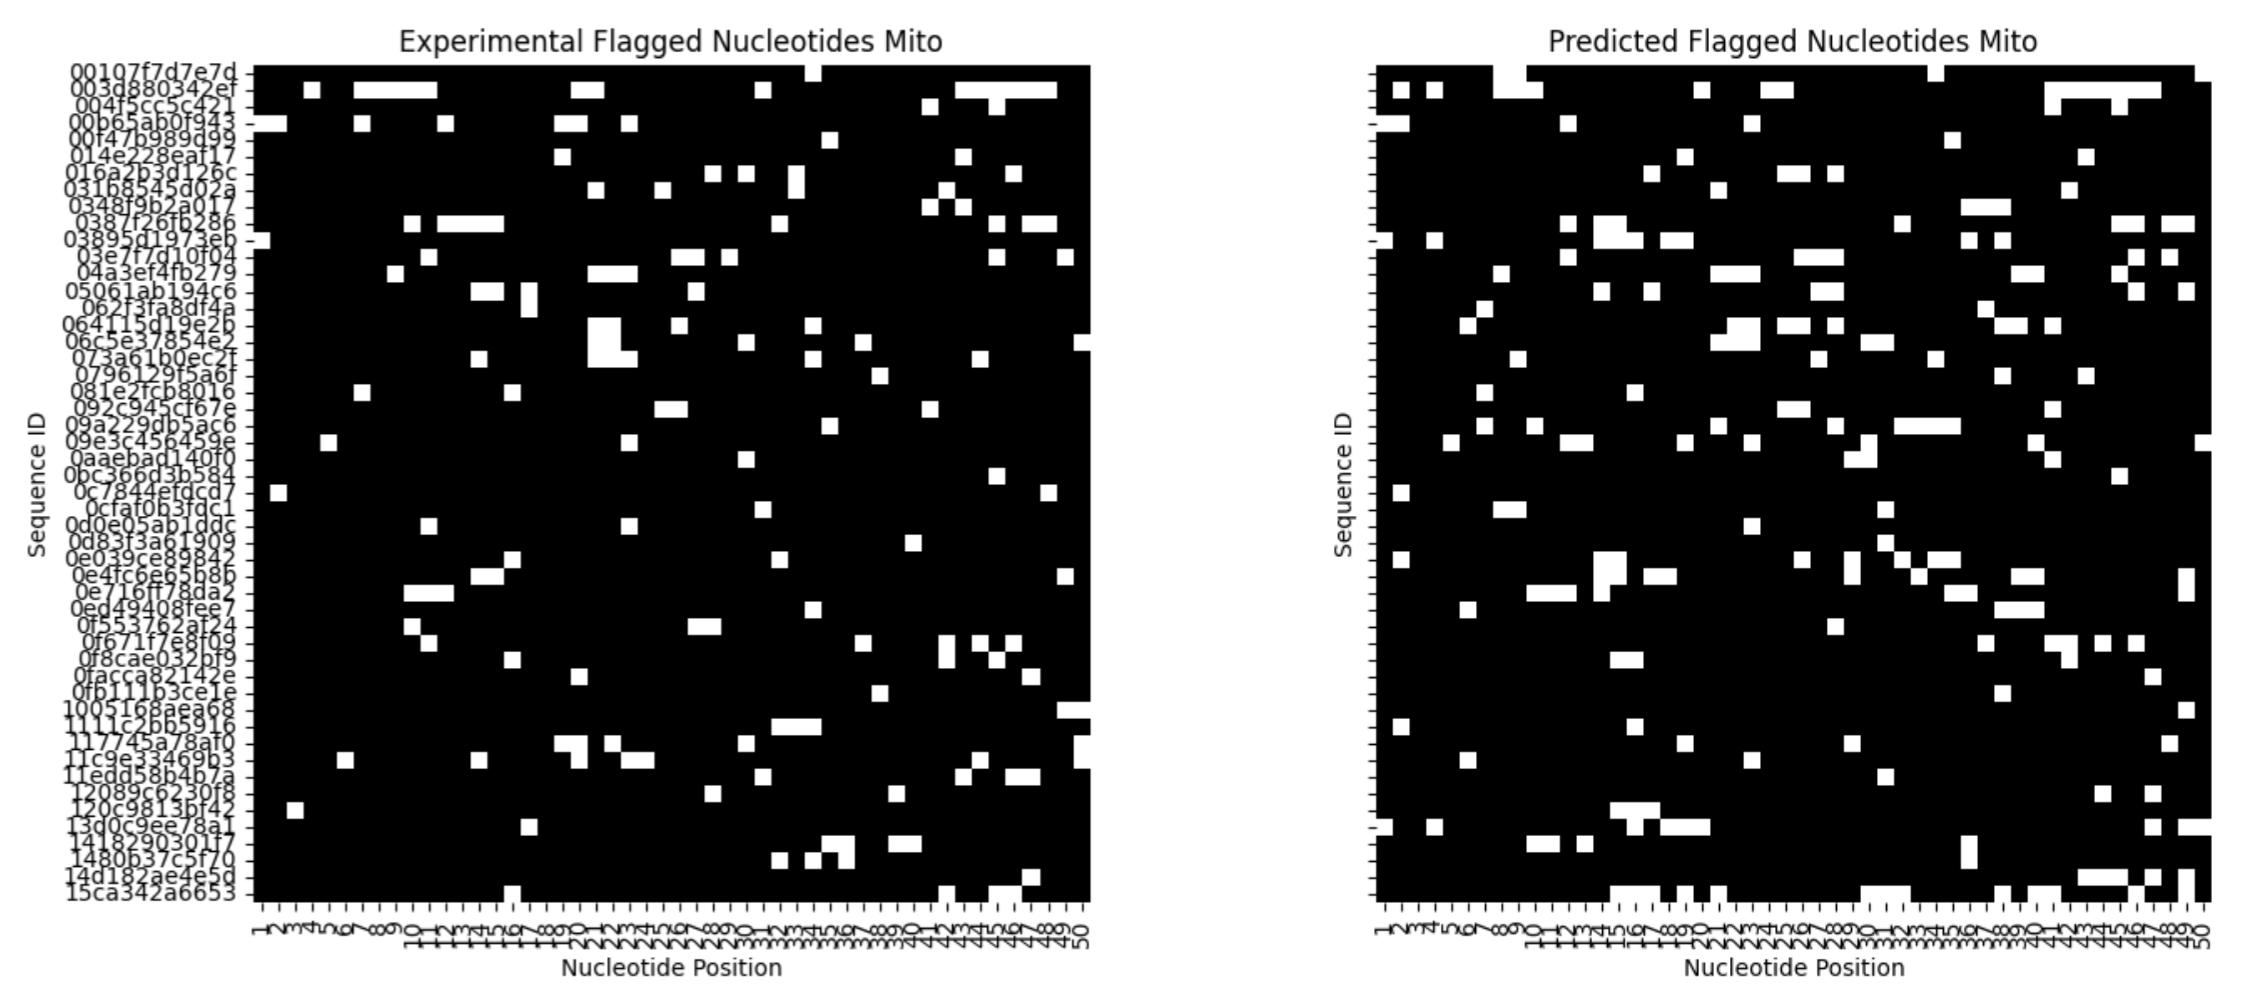
You can clone this repo and then run the jupyter NB within this repo to try evaluating predictions by changing the threshold required for a nucleotide to be “flagged”.
References
(1) Martin, S.; Blankenship, C.; Rausch, J. W.; Sztuba-Solinska, J. Using SHAPE-MaP to Probe Small Molecule-RNA Interactions. Methods 2019, 167, 105–116. https://doi.org/10.1016/j.ymeth.2019.04.009.
(2) Zeller, M. J.; Favorov, O.; Li, K.; Nuthanakanti, A.; Hussein, D.; Michaud, A.; Lafontaine, D. A.; Busan, S.; Serganov, A.; Aubé, J.; Weeks, K. M. SHAPE-Enabled Fragment-Based Ligand Discovery for RNA. Proc. Natl. Acad. Sci. U. S. A. 2022, 119 (20), e2122660119. https://doi.org/10.1073/pnas.2122660119.
(3) Wilkinson, K. A.; Merino, E. J.; Weeks, K. M. Selective 2’-Hydroxyl Acylation Analyzed by Primer Extension (SHAPE): Quantitative RNA Structure Analysis at Single Nucleotide Resolution. Nat. Protoc. 2006, 1 (3), 1610–1616. https://doi.org/10.1038/nprot.2006.249.
(4) Tijerina, P.; Mohr, S.; Russell, R. DMS Footprinting of Structured RNAs and RNA-Protein Complexes. Nat. Protoc. 2007, 2 (10), 2608–2623. https://doi.org/10.1038/nprot.2007.380.